Внимание: для входа на форум используйте e-mail вместо ника, пароль остаётся прежним. Если вы забыли свой e-mail пишите в техподдержку ( MFadmin@bk.ru )


MDunleavy
-
Постов
157 -
Зарегистрирован
-
Посещение
Тип контента
Профили
Галерея
Блоги
События
Магазин
Загрузки
Форумы
Весь контент MDunleavy
-
Есть такое предположение, что Япония обеспокоенная ростом своей валюты скоординирует этот процесс. масса публикаций на эту тему. Поэтому в основном исходя из фундаментальный данных рассчитываю на рос валютной пары евро\ена. Very risky trading idea : EUR/JPY - Buy at 109.20-80; Target: 114.00-60 ; Stop: 108.60. =============================== EURJPY Outlook The EURJPY slipped below 109.20 support area yesterday but whipsawed to the upside, topped at 110.42, closed at 110.17 and traded lower earlier today in Asian session around 109.90 at the time I wrote this comment. Overall we are still in bearish outlook after violation to the bullish channel but price still trapped in range area between 110.70 – 109.20. We need a consistent move below 109.20 to continue the bearish pressure testing 108.07 – 107.30 area. On the upside, break above 110.70 could be a serious threat to the bearish outlook. (fxinstructor) "P&F EURJPY30 Box Size 30X4 or(1.08%) HI/LO Data 114.724 - 107.306 ~ 2 Month ~ 61.15 Day Database 2054 records 109.712 (Last Close) 2010-06-18 04~00 2010-08-18 07~30 (GMT+01:00) Paris BJF Trading Group MDunleavy chart" 114.60|~3O|||________________________________________x_+_______________|0.11%|6.8% 114.30|~6O|||________________________________________x_o_+_____________|0.37%|6.52% 114.00|~9O|||________________________________________x_o_x_+___________|0.63%|6.24% 113.70|~12O||+_______________________________________x_o_x_o_+_________|0.89%|5.96% 113.40|~15O||x_+_____________________________________x_o_x_o___+_______|1.15%|5.68% 113.10|~18O||x_o_+_______________x___x___x___________x_o_x_o_____+_____|1.42%|5.4% 112.80|~21O||x_o___+_____________x_o_x_o_x_o_x___x___x_o_x_o_______+___|1.68%|5.12% 112.50|~24O||x_o_____+_______x___x_o_x_o_x_o_x_o_x_o_x_o_x_o_________+_|1.94%|4.84% 112.20|~27O||x_o_______+_____x_o_x_o_x_o_x_o_x_o_x_o_x_o___o___________|2.2%|4.56% 111.90|~3OO||__o_________+___x_o_x_o___o_x_o_x_o_x_o_x_____o___________|2.46%|4.28% 111.60|~33O||__o___________+_x_o_x_____o___o_+_o_x_o_______o___________|2.72%|4% 111.30|~36O||__o_____________x_o_x_________+___o_x_______+_o___________|2.98%|3.72% 111.00|~39O||__o_____________x_o_x_______+_____o_x_____+___o_____x_____|3.25%|3.44% 110.70|~42O||__o_____x___x___x_o_______+_______o_x___+_____o_x___x_o___|3.51%|3.16% 110.40|~45O||__o_____x_o_x_o_x_______+_________o_x_+_______o_x_o_x_o_x_|3.77%|2.88% 110.10|~48O||__o_____x_o_x_o_x_____+___________o_+_________o_x_o_x_o_x_|4.03%|2.6% 109.80|~51O||__o_____x_o_x_o_x___+_____________+___________o_x_o_x_o_x_|4.29%|2.32% 109.50|~54O||__o_____x_o_x_o___+___________________________o___o___o_x_|4.55%|2.04% 109.20|~57O||__o_____x_o_____+_____________________________________o_+_|4.82%|1.77% 108.90|~6OO||__o_x___x_____+_______________________________________+___|5.08%|1.49% 108.60|~63O||__o_x_o_x___+_____________________________________________|5.34%|1.21% 108.30|~66O||__o_x_o_x_+_______________________________________________|5.6%|0.93% 108.00|~69O||__o_x_o_x_________________________________________________|5.86%|0.65% 107.70|~72O||__o_x_o___________________________________________________|6.12%|0.37% 107.40|~75O||__o_+_____________________________________________________|6.38%|0.09% 107.10|~78O||__+_______________________________________________________|6.65%|-0.19% Column|~81O||5_2_5_4_1_5_5_4_1_6_8_4_4_5_5_5_4_9_9_4_1_8_6_1_4_4_5_6_4_| Count|~84O|||__O_____O_______O_______________________O_____5___________| http://iticsoftware.com/postimages/201005/2010-Aug-18_095013Mane.PNG http://iticsoftware.com/postimages/201005/2010-Aug-18_095013Large.PNG BJF Trading Group. Excel Chart. Full size attached. 2010-Aug-18_114136.zip
-
Мощнейший за последнее время бросок индекса доллара. Так уж серьёзны намерения американской валюты? Но в краткосрочно-среднесрочном периоде предполагаю дальнейший рост индекса. Подробности на графике. Dollar index has best week in nearly 2 years. Aug 13 (Reuters) - The dollar on Friday marked its best week against a basket of major currencies in nearly two years, as worries about the strength of the global economy fed short- covering and safe-haven demand for the greenback. The dollar index .DXY, which measures the greenback against six major currencies, rose 3.2 percent this week to 82.943. That was the biggest weekly gain since it rose nearly 5 percent in the week ended Oct. 26, 2008. Worries that a slower U.S. economy could cause headwinds for global growth led investors to sell risky assets and buy dollars as a safe-haven play, traders said The US Dollar Index rallied off support at 80. Penetration of the descending trendline indicates that the down-trend is weakening. "P&F _DXY10080 Box Size20X3 or(6.28%) HI/LO Data 120.51 - 70.7 ~ 211 Month ~ 6405 Day Database 916 records 82.92 (Last Close) 1993-01-24 00~00 2010-08-08 00~00 (GMT+01:00) Paris BJF Trading Group MDunleavy chart" 120.0|~2OO||__________________o_x_+_____________________|0.42%|69.73% 118.0|~4OO||____________x___x_o_x_o_+___________________|2.08%|66.9% 116.0|~6OO||____________x_o_x_o_x_o___+_________________|3.74%|64.07% 114.0|~8OO||____________x_o_x_o_x_o_____+_______________|5.4%|61.24% 112.0|~1OOO|____________x_o_x_o___o_______+_____________|7.06%|58.42% 110.0|~12OO|____________x_o_______o_________+___________|8.72%|55.59% 108.0|~14OO|____________x_________o___________+_________|10.38%|52.76% 106.0|~16OO|____________x_________o_____________+_______|12.04%|49.93% 104.0|~18OO|________x___x_________o_______________+_____|13.7%|47.1% 102.0|~2OOO|____x___x_o_x_________o_________________+___|15.36%|44.27% 100.0|~22OO|____x_o_x_o_x_________o___________________+_|17.02%|41.44% 98.00|~24OO|____x_o_x_o_________+_o_x___________________|18.68%|38.61% 96.00|~26OO|x___x_o_x_________+___o_x_o_________________|20.34%|35.79% 94.00|~28OO|x_o_x_o_x_______+_____o_x_o_________________|22%|32.96% 92.00|~3OOO|x_o_x_o_______+_______o___o_x_______________|23.66%|30.13% 90.00|~32OO|x_o_x_______+_____________o_x_o_____________|25.32%|27.3% 88.00|~34OO|__o_x_____+_______________o_x_o_x___x___x___|26.98%|24.47% 86.00|~36OO|__o_x___+_________________o_x_o_x_o_x_o_x_o_|28.64%|21.64% 84.00|~38OO|__o_x_+___________________o_x_o_x_o_x_o_x_o_|30.3%|18.81% 82.00|~4OOO|__o_+_____________________o___o_x_o_x_o_x_o_|31.96%|15.98% 80.00|~42OO|__+___________________________o_x_o_x_o_x___|33.62%|13.15% 78.00|~44OO|______________________________o_x_o___o_x_+_|35.28%|10.33% 76.00|~46OO|______________________________o_x___+_o_+___|36.93%|7.5% 74.00|~48OO|______________________________o_x_+___+_____|38.59%|4.67% 72.00|~5OOO|______________________________o_+___________|40.25%|1.84% 70.00|~52OO|______________________________+_____________|41.91%|-0.99% Column||||||4_7_1_5_6_3_1_4_4_5_4_1_3_8_5_1_8_5_5_6_6_3_| Count|||||||____O_______O_________4_______O_____________| http://iticsoftware.com/postimages/201005/2010-Aug-14_202458Mane.PNG http://iticsoftware.com/postimages/201005/2010-Aug-14_203633Large.PNG BJF Trading Group. Excel Chart. Full size attached. 2010-Aug-15_070729.ZIP
-
Возможно коррекционный рост нефти ещё не закончен. Предполагаю тестирование недавних максимумов. Crude oil edged further higher to 82.97 last week but retreat sharply since then. A temporary top is at least formed and initial bias is neutral this week. We’d continue to seem more retreat below 82.97 first. Nevertheless, note that another rise remains in favor as long as 75.90 support holds. Above 82.97 will target 100% projection of 64.23 to 79.38 from 71.09 at 86.24 next. However, break of 75.9 will be the first signal that whole rebound from 64.23 is finished and will turn focus to 71.09 support for confirmation.The text is written by Oilngold. "P&F O I L (brent) Box Size $1X3 or(3.71%) CLOSE Data 91.94 - 69.75 ~ 4 Month ~ 114.67 Day Database 2000 records 80.33 (Last Close) 2010-04-14 05~00 2010-08-06 21~00 (GMT+01:00) Paris MDunleavy chart" 92.00|~1OO||__+___________________________________________|-0.07%|31.9% 91.00|~2OO||__x_+_________________________________________|1.02%|30.47% 90.00|~3OO||__x_o_+_______________________________________|2.11%|29.03% 89.00|~4OO||__x_o___+_____________________________________|3.2%|27.6% 88.00|~5OO||o_x_o_____+___________________________________|4.29%|26.16% 87.00|~6OO||o_x_o_______+_________________________________|5.37%|24.73% 86.00|~7OO||o_x_o_________+_______________________________|6.46%|23.3% 85.00|~8OO||o___o___________+_____________________________|7.55%|21.86% 84.00|~9OO||____o_x___________+___________________________|8.64%|20.43% 83.00|~1OOO|____o_x_o___________+_____________________+___|9.72%|19% 82.00|~11OO|____o_x_o_____________+___________________x_+_|10.81%|17.56% 81.00|~12OO|____o_x_o_______________+_________________x_o_|11.9%|16.13% 80.00|~13OO|____o___o_________________x_______________x_o_|12.99%|14.7% 79.00|~14OO|________o_________________x_o_x___________x_o_|14.07%|13.26% 78.00|~15OO|________o_________________x_o_x_o_____x___x___|15.16%|11.83% 77.00|~16OO|________o_____________x___x_o_x_o_x___x_o_x___|16.25%|10.39% 76.00|~17OO|________o_____x___x___x_o_x_o___o_x_o_x_o_x_+_|17.34%|8.96% 75.00|~18OO|________o_____x_o_x_o_x_o_x_____o_x_o_x_o_+___|18.43%|7.53% 74.00|~19OO|________o_x___x_o_x_o_x_o_x_____o_x_o___+_____|19.51%|6.09% 73.00|~2OOO|________o_x_o_x_o___o_+_o_x_____o_x___+_______|20.6%|4.66% 72.00|~21OO|________o_x_o_x_____+___o_______o_x_+_________|21.69%|3.23% 71.00|~22OO|________o___o_x___+_____________o_+___________|22.78%|1.79% 70.00|~23OO|____________o_x_+_______________+_____________|23.86%|0.36% 69.00|~24OO|____________o_+_______________________________|24.95%|-1.08% ||||||~25OO|____________+_________________________________|100%|-100% Column||||||4_6_1_4_1_3_5_7_3_3_3_4_5_8_4_3_8_6_3_4_3_7_3_| Count|||||||____1___3_____________________________________| http://iticsoftware.com/postimages/201005/2010-Aug-07_202514Mane.PNG http://iticsoftware.com/postimages/201005/2010-Aug-07_202703Large.PNG Excel Chart. Full size attached. 2010-Aug-08_05~55~02.zip
-
Предполагаю возможную консолидацию перед возможным дальнейшим ростом пары. As expected, Cable moved up in the Asian and the European sessions today to touch a high of 1.5968. The pair honoured the Resistance at 1.5970 (61.8% retracement of the fall from 1.7042 (Aug-09) to 1.4227 (May-09)) and is currently trading lower. We may see the markets go down towards 1.5900-1.5700, before another rally beyond 1.60 figure in the coming days. "P&F GBPUSD1 Box Size 5X3 or(0.09%) CLOSE Data 1.5965 - 1.5862 ~ 0 Month ~ 0.53 Day Database 768 records 1.59201 (Last Close) 2010-08-03 02~34 2010-08-03 15~24 (GMT+01:00) Paris BJF Trading Group MDunleavy chart" 1.5965|~5||||______________________________|0%|0.65% 1.5960|~1O|||______________x___x_______+___|0.03%|0.62% 1.5955|~15|||__________x___x_o_x_o_____x_+_|0.06%|0.59% 1.5950|~2O|||__________x_o_x_o_x_o_____x_o_|0.09%|0.55% 1.5945|~25|||__________x_o_x_o_x_o_____x_o_|0.13%|0.52% 1.5940|~3O|||__________x_o_x_o_x_o_x___x_o_|0.16%|0.49% 1.5935|~35|||__________x_o___o_x_o_x_o_x_o_|0.19%|0.46% 1.5930|~4O|||__________x_____o_x_o_x_o_x_o_|0.22%|0.43% 1.5925|~45|||______x___x_____o_x_o___o___o_|0.25%|0.4% 1.5920|~5O|||______x_o_x_____o_x_______+_o_|0.28%|0.37% 1.5915|~55|||______x_o_x_____o_x_____+___o_|0.31%|0.33% 1.5910|~6O|||______x_o_x_____o_x___+_____+_|0.34%|0.3% 1.5905|~65|||______x_o_x_____o_x_+_________|0.38%|0.27% 1.5900|~7O|||______x_o_x_____o_+___________|0.41%|0.24% 1.5895|~75|||______x_o_______+_____________|0.44%|0.21% 1.5890|~8O|||______x_______+_______________|0.47%|0.18% 1.5885|~85|||o_____x_____+_________________|0.5%|0.15% 1.5880|~9O|||o_x___x___+___________________|0.53%|0.11% 1.5875|~95|||o_x_o_x_+_____________________|0.56%|0.08% 1.5870|~1OO||o_x_o_x_______________________|0.6%|0.05% 1.5865|~1O5||o_x_o_________________________|0.63%|0.02% 1.5860|~11O||o_+___________________________|0.66%|-0.01% Column|~115||6_4_3_1_6_1_4_5_1_1_7_3_3_6_8_| Count|~12O|||______2___2_____2_2___________| http://iticsoftware.com/postimages/201005/2010-Aug-03_143812Mane.png http://iticsoftware.com/postimages/201005/2010-Aug-03_152244Large.PNG BJF Trading Group. Excel Chart. Full size.
-
Предполагаю дальнейшее снижение, подробности на графике. Gold' fall from 1266.5 resumes by taking out 1175.1 and reaches as slow as 1156.9 so far. Short term outlook will now remain bearish as long as 1203.9 resistance holds and we'd expect deeper decline to 1124.3 support next. "P&F GOLD30 Box Size $6X3 or(1.49%) HI/LO Data 1265.02 - 1157.88 ~ 2 Month ~ 62.92 Day Database 2056 records 1161.33 (Last Close) 2010-05-26 16~00 2010-07-28 14~00 (GMT+01:00) Paris BJF Trading Group MDunleavy chart" 1260.00|~6$||__________________x_+_____________|0.4%|8.82% 1254.00|~12$|__________x_o_x_o___o_+___________|0.87%|8.3% 1248.00|~18$|______x___x_o_x_____o___+_________|1.35%|7.78% 1242.00|~24$|______x_o_x_o_x_____o_____+_______|1.82%|7.27% 1236.00|~3O$|______x_o_x_o_x___+_o_______+_____|2.29%|6.75% 1230.00|~36$|______x_o_x_o___+___o_________+___|2.77%|6.23% 1224.00|~42$|__x___x_o_x___+_____o___________+_|3.24%|5.71% 1218.00|~48$|o_x_o_x_o___+_______o_____________|3.72%|5.19% 1212.00|~54$|o_x_o_x___+_________o_____x_______|4.19%|4.67% 1206.00|~6O$|o___o_x_+___________o_x___x_o_____|4.67%|4.16% 1200.00|~66$|____o_+_____________o_x_o_x_o_x___|5.14%|3.64% 1194.00|~72$|____+_______________o_x_o_x_o_x_o_|5.61%|3.12% 1188.00|~78$|____________________o___o___o_x_o_|6.09%|2.6% 1182.00|~84$|____________________________o_x_o_|6.56%|2.08% 1176.00|~9O$|____________________________o_+_o_|7.04%|1.56% 1170.00|~96$|____________________________+___o_|7.51%|1.05% 1164.0|~1O2$|________________________________oV|7.99%|0.53% 1158.0|~1O8$|________________________________oV|8.46%|0.01% 1152.0|~114$|________________________________+V|8.93%|-0.51% Column|||||||3_3_4_8_5_6_5_4_1_1_1_3_3_4_6_4_7V| Count||||||||____________________2____________V| http://iticsoftware.com/postimages/201005/BJF-Trading-Group-GOLD0728-Mane.PNG http://iticsoftware.com/postimages/201005/BJF-Trading-Group-GOLD0728-Large.PNG BJF Trading Group. Excel Chart. Full size.
-
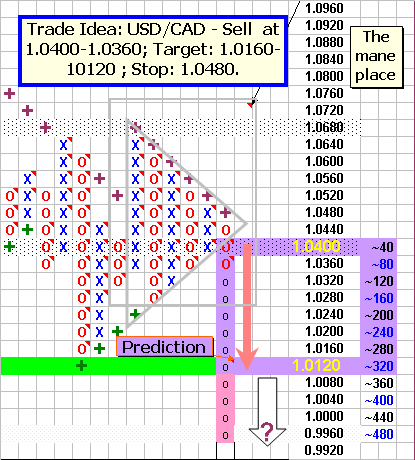
Возможно снижение канадского доллара , во всяком случае есть сигналы об этом. Как будет на самом деле увидим через некоторое время... Last week, US data and the European bank stress test results stole most of the headlines. Canada has quietly seen their currency strengthen towards the lower part of its' recent range. Tuesday saw an increase of 25 basis points on their overnight rate. Canadian Retail Sales and Consumer Price Index printed below expectations, but the currency benefited from the stabilization of commodities. While the outlook for future rate hikes is dismal, the Canadian economy is significantly in a better position than the US.Written by FX Solutions.USDCAD strength can continue towards 1.02. "P&F USDCAD30 Box Size 40X3 or(1.15%) HI/LO Data 1.0744 - 1.0138 ~ 2 Month ~ 58.98 Day Database 2048 records 1.03572 (Last Close) 2010-05-25 23~00 2010-07-23 22~30 (GMT+01:00) Paris BJF Trading Group MDunleavy chart" 1.0760|~4O|||+_______________________________|-0.15%|6.14% 1.0720|~8O|||x_o_____________________________|0.22%|5.74% 1.0680|~12O||x_o_+_______________+___________|0.6%|5.35% 1.0640|~16O||__o___+_____x_______x_+_________|0.97%|4.95% 1.0600|~2OO||__o_____+___x_o_____x_o_+_______|1.34%|4.56% 1.0560|~24O||__o_x___x_+_x_o_____x_o_x_+_____|1.71%|4.16% 1.0520|~28O||__o_x_o_x_o_x_o_____x_o_x_o_+___|2.08%|3.77% 1.0480|~32O||__o_x_o_x_o_x_o_____x_o_x_o_x_+_|2.46%|3.37% 1.0440|~36O||__o___o___o_x_o_x___x_o_x_o_x_o_|2.83%|2.98% 1.0400|~4OO||__________o_x_o_x_o_x_o_x_o_x_o_|3.2%|2.58% 1.0360|~44O||__________o___o_x_o_x_o_x_o___o_|3.57%|2.19% 1.0320|~48O||______________o_x_o___o_x_____V_|3.95%|1.8% 1.0280|~52O||______________o_x_____o_______V_|4.32%|1.4% 1.0240|~56O||______________o_x___+_________V_4.69%|1.01% 1.0200|~6OO||______________o_x_+___________V_5.06%|0.61% 1.0160|~64O||______________o_+_____________V_5.44%|0.22% 1.0120|~68O||______________+_________________|5.81%|-0.18% Column|~72O||2_8_3_3_3_5_7_1_7_3_8_9_7_5_3_3_| Count||~76O||______________2_________________| BJF Trading Group. Excel Chart. Full size attached BJF-Trading-Group-UsdCad0722.zip
-
Предполагаю откат возможно даже до уровня 1,25. The EUR penetrated resistance at 1.2500 and the descending trend line. It is too early to call this a reversal, but the primary down trend is weakening. Expect retracement to test the new support level at 1.2500. Failure of the rising trend line would warn of a primary down swing with a target of parity - confirmed if support at 1.1900 is broken. Respect of support would suggest a reversal, but confirmation would only come from a higher trough followed by a new high. "P&F EURUSD240 Box Size 10X3 or(2.22%) HI/LO Data 1.5144 - 1.1876 ~ 8 Month ~ 247.17 Day Database 1050 records 1.29296 (Last Close) 2009-11-11 16~00 2010-07-16 20~00 (GMT+01:00) Paris BJF Trading Group MDunleavy chart" http://iticsoftware.com/postimages/201005/BJF-Trading-Group-EurUsd0717tumb.PNG BJF Trading Group. Excel Chart. Full size.
-
Предположительно на следующей неделе возможен рост пары новозеландский доллар\доллар США. В целом пара находится в нисходящем движении, однако коррекция от роста 0.4908-0.7633 произошла ( 0.6560 38,2%). И не исключено, что пара может подняться в район 0.7240 и даже выше 0.7360. The New Zealand Dollar pared the decline from June following a shift in market sentiment, and the high-yielding currency may continue to trend higher over the following week as investors raise their appetite for risk. "P&F NZDUSD10080 Box Size 150X3 or(7.43%) HI/LO Data 0.8214 - 0.39 ~ 246 Month ~ 7483 Day Database 1070 records 0.71037 (Last Close) 1990-01-07 00~00 2010-07-04 00~00 (GMT+01:00) Paris BJF Trading Group MDunleavy chart" http://iticsoftware.com/postimages/201005/BJF-Trading-Group-NzdUsd0710tumb.PNG BJF Trading Group. Excel Chart. Full size.
-
Австралийский доллар предположительно на следующей неделе будет находиться в горизонтальном движении. Можно рассматривать сигналы на покупку и продажу. AUD/USD Weekly Outlook AUD/USD dropped sharply to as low as 0.8315 last week. The break of 0.8549 support suggests that corrective rise from 0.8066 is finished with three waves up to 0.8858, just ahead of 61.8% retracement of 0.9380 to 0.8066 at 0.8878. While some recovery might be seen initially this week, we'd expect upside to be limited well below 0.8858 resistance and bring fall resumption. Below 0.8315 will target a test on 0.8066 support next. The text is written by ActionForex. "P&F AUDUSD10080 Box Size 20X3 or(8.21%) HI/LO Data 0.9849 - 0.4773 ~ 252 Month ~ 7686 Day Database 1099 records 0.84138 (Last Close) 1989-06-11 00~00 2010-06-27 00~00 (GMT+01:00) Paris BJF Trading Group MDunleavy chart" http://iticsoftware.com/postimages/201005/BJF-Trading-Group-AudUsd0703tumb.PNG BJF Trading Group. Excel Chart. Full size.
-
Уже пора бы вверх двигаться.... This pair fell to new lows this week. Prices eventually found temporary support from the trend-line for the rally up from the November ’09 lows and the lower channel line of the 4th of June descent. There are some bullish signs including momentum diverging bullishly and the Elliot wave count is showing a possible start of a small 4th wave although more upside is required to confirm. If this is the case the market may rise slowly over the next week to 90.50, which is also the lower border of the Ichimoku cloud. A break lower, however, could lead to 87.00, the point and figure target down and also the old support lows from the ‘08/’09 bottom. They may also pause on the way down at a support at 88.17. "P&F USDJPY10080 Box Size60X3 or(10.05%) HI/LO Data 278.31 - 79.75 ~ 389 Month ~ 11858 Day Database 1695 records 89.223 (Last Close) 1978-01-01 00~00 2010-06-20 00~00 (GMT+01:00) Paris BJF Trading Group MDunleavy chart" http://iticsoftware.com/postimages/201005/BJF-Trading-Group-UsdJpy0626tumb.PNG BJF-Trading-Group_Excel_Chart
-
Экзотический кросс австралийский доллар\швейцарский франк. Пара отличается стабильной сменой магистрального тренда. Практически синусоида. Может подойти под какую-то специфическую торговую систему. How you can see, the AUD/CHF has been moving along two horizontal levels around 0.9855 and 0.9575. After touching the resistance level at June 14th, the pair pulled down and reached the support line around 0.9575. While the RSI indicator has reached the level at 30, we might expect a pull-back towards the resistance level around 0.9855. "P&F AUDCHF10080 Box Size 1750X5 or(9.13%) HI/LO Data 1.2232 - 0.6929 ~ 236 Month ~ 7182 Day Database 1027 records 0.97252 (Last Close) 1990-10-21 00~00 2010-06-20 00~00 (GMT+01:00) Paris BJF Trading Group MDunleavy chart" 1.2250|~175||__+_____________________________________________________________|-0.15%|76.79% 1.2075|~35O||__x_+___________________________________________________________|1.28%|74.27% 1.1900|~525||__x_o_x___________________+_____________________________________|2.71%|71.74% 1.1725|~7OO||__x_o_x_o_________________x_+___________________________________|4.14%|69.22% 1.1550|~875||__x_o_x_o_+_______________x_o_+_________________________________|5.58%|66.69% 1.1375|~1O5O|__x_o_x_o___+_____________x_o___+_______________________________|7.01%|64.17% 1.1200|~1225|__x_o_x_o_____+___________x_o_____+_____________________________|8.44%|61.64% 1.1025|~14OO|__x_o_x_o_______+_________x_o_______+___________________________|9.87%|59.11% 1.0850|~1575|__x_o_x_o_x_______+_______x_o_________+_______________+_________|11.3%|56.59% 1.0675|~175O|__x_o_x_o_x_o_____x_+_____x_o_____x_____+_________x___x_+_______|12.73%|54.06% 1.0500|~1925|__x_o_x_o_x_o_x___x_o_+___x_o_x___x_o_____+_______x_o_x_o_+_____|14.16%|51.54% 1.0325|~21OO|__x_o___o_x_o_x_o_x_o_x_+_x_o_x_o_x_o_______+_____x_o_x_o___+___|15.59%|49.01% 1.0150|~2275|__x_____o_x_o_x_o_x_o_x_o_x_o_x_o_x_o_________+___x_o_x_o_____x_|17.02%|46.49% 0.9975|~245O|__x_____o_x_o_x_o_x_o_x_o_x_o_x_o_x_o___________+_x_o_x_o_x___x_|18.45%|43.96% 0.9800|~2625|o_x_____o_x_o_x_o_x_o_x_o_x_o_x_o_x_o_________x___x_o_x_o_x_o_x_|19.88%|41.43% 0.9625|~28OO|o_______o_x_o___o_x_o_x_o_x_o_x_o_x_o_________x_o_x_o_x_o_x_o_x_|21.31%|38.91% 0.9450|~2975|________o_x_____o_x_o_x_o_x_o_x_o___o_x_______x_o_x_o___o_x_o_x_|22.74%|36.38% 0.9275|~315O|________o_x_____o_x_o_x_o_x_o_x_____o_x_o_____x_o_x_____o_x_o_x_|24.17%|33.86% 0.9100|~3325|________o_x_____o___o___o_x_o_x_____o_x_o_____x_o_x_____o_x_o_x_|25.6%|31.33% 0.8925|~35OO|________o_______________o_x_o_x_____o_x_o_x___x_o_x_____o___o_x_|27.04%|28.81% 0.8750|~3675|________________________o_x_o_x_____o_x_o_x_o_x_o_x___+_____o_x_|28.47%|26.28% 0.8575|~385O|________________________o_x_o_x_____o_x_o_x_o_x_o___+_______o_x_|29.9%|23.76% 0.8400|~4O25|________________________o_x_o_x_____o_x_o_x_o_x___+_________o_x_|31.33%|21.23% 0.8225|~42OO|________________________o_x_o_x_____o___o_x_o_x_+___________o_x_|32.76%|18.7% 0.8050|~4375|________________________o___o___________o_x_o_x_____________o_x_|34.19%|16.18% 0.7875|~455O|________________________________________o_x_o_______________o_x_|35.62%|13.65% 0.7700|~4725|________________________________________o_+_________________o_x_|37.05%|11.13% 0.7525|~49OO|________________________________________+___________________o_x_|38.48%|8.6% 0.7350|~5O75|____________________________________________________________o_x_|39.91%|6.08% 0.7175|~525O|____________________________________________________________o_x_|41.34%|3.55% 0.7000|~5425|____________________________________________________________o_+_|42.77%|1.02% 0.6825|~56OO|____________________________________________________________+___|44.2%|-1.5% Column|||||||2_1_1_9_1_1_7_5_8_9_9_7_1_2_2_1_6_7_1_7_1_7_6_1_7_1_7_7_1_6_1_1_| Count||||||||__4_O___7_1_____________3_1_1_4_____4___O_____1___2_____O___7_8_| http://iticsoftware.com/postimages/201005/BJF-Trading-Group-AudChf0621tumb.PNG BJF-Trading-Group_Excel_Chart
-
Вот такой вариант предлагаю. First. Trade Idea: EUR/USD - Buy Limit at 1.2100; Target: 1.2250; Stop: 1.2025. Then. Trade Idea: EUR/USD - Sell Limit at 1.2250; Target: 1.1650 ; Stop: 1.2325. The EUR/USD finally broke below the triangle, but did so after two false breakouts. The pair has moved higher after putting in lows below 1.1900. The week was closed out with the EUR/USD at 1.2110. The resistance comes in at 1.2150-1.2200. This is the former support level which created the triangle (see chart at bottom). If that resistance band hold, expect continued selling pressure. Support comes in at 1.2050, 1.1950 and 1.1875. Penetration of the recent low at 1.1875 has a target of 1.1650. "P&F EURUSD10080 Box Size 250X3 or(6.18%) HI/LO Data 1.6038 - 0.8225 ~ 152 Month ~ 4627 Day Database 662 records 1.21112 (Last Close) 1997-10-05 00~00 2010-06-06 00~00 (GMT+01:00) Paris BJF Trading Group MDunleavy chart" 1.6000|~25O||______________________x_+_________________|0.24%|94.53% 1.5750|~5OO||______________________x_o_+_______________|1.8%|91.49% 1.5500|~75O||______________________x_o___+_____________|3.35%|88.45% 1.5250|~1OOO|______________________x_o_____+_______+___|4.91%|85.41% 1.5000|~125O|______________________x_o_______+_____x_+_|6.47%|82.37% 1.4750|~15OO|______________________x_o_x_______+___x_o_|8.03%|79.33% 1.4500|~175O|______________________x_o_x_o_____x_+_x_o_|9.59%|76.29% 1.4250|~2OOO|______________________x_o_x_o_____x_o_x_o_|11.15%|73.25% 1.4000|~225O|______________________x_o___o_____x_o_x_o_|12.71%|70.21% 1.3750|~25OO|______________________x_____o_____x_o_x_o_|14.27%|67.17% 1.3500|~275O|__________________x___x_____o_____x_o_x_o_|15.82%|64.13% 1.3250|~3OOO|__________________x_o_x_____o_x___x_o_x_o_|17.38%|61.09% 1.3000|~325O|__________________x_o_x_____o_x_o_x_o_x_o_|18.94%|58.05% 1.2750|~35OO|______________x___x_o_x_____o_x_o_x_o_x_o_|20.5%|55.02% 1.2500|~375O|______________x_o_x_o_x_____o___o___o___o_|22.06%|51.98% 1.2250|~4OOO|__x___________x_o_x_o_x_______________+_o_|23.62%|48.94% 1.2000|~425O|__x_o_________x_o___o_x_____________+___o_|25.18%|45.9% 1.1750|~45OO|==x=o=====x===x=====o=============+=====+=|26.74%|42.86% 1.1500|~475O|__x_o_____x_o_x_________________+_________|28.3%|39.82% 1.1250|~5OOO|o_x_o_____x_o_x_______________+___________|29.85%|36.78% 1.1000|~525O|o_x_o_____x_o_______________+_____________|31.41%|33.74% 1.0750|~55OO|o___o_____x_______________+_______________|32.97%|30.7% 1.0500|~575O|____o_____x_____________+_________________|34.53%|27.66% 1.0250|~6OOO|____o_____x___________+___________________|36.09%|24.62% 1.0000|~625O|____o_____x_________+_____________________|37.65%|21.58% 0.9750|~65OO|____o_____x_______+_______________________|39.21%|18.54% 0.9500|~675O|____o_x___x_____+_________________________|40.77%|15.5% 0.9250|~7OOO|____o_x_o_x___+___________________________|42.32%|12.46% 0.9000|~725O|____o_x_o_x_+_____________________________|43.88%|9.42% 0.8750|~75OO|____o_x_o_x_______________________________|45.44%|6.38% 0.8500|~775O|____o_x_o_________________________________|47%|3.34% 0.8250|~8OOO|____o_+___________________________________|48.56%|0.3% 0.8000|~825O|____+_____________________________________|50.12%|-2.74% Column|||||||3_6_1_5_4_1_3_7_3_6_7_1_8_3_9_3_3_8_8_1_1_| Count||||||||____6_____3___________7_______________O_2_| http://iticsoftware.com/postimages/201005/BJF-Trading-Group-EurUsd0613tumb.PNG BJF-Trading-Group_Excel_Chart
-
Сейчас только ленивый не прогнозирует падение евро, но всё же не может оно падать бесконечно. Ну станет потом маркой или франком если уж совсем печально в евросоюзе дела пойдут... В фаворе канадский доллар! Ну прям валюта процветания. Trade Idea: EUR/CAD - Buy Stop at 1.2540; Target: 1.2660 ; Stop: 1.2360. (At first) Trade Idea: EUR/CAD - Sell Limit at 1.2660; Target: 1.236 ; Stop: 1.2780. (Then) After trading above the middle line of the pitchfork channel over the past trading days, the EUR/CAD has decided to break the middle level of the fork. As you can see, the pair is still trading inside the bearish trend channel from the end of May. This might be a signal for further falls inside the downward trend channel. "P&F EURCAD1440 Box Size 150X4 or(4.01%) HI/LO Data 1.7499 - 1.2449 ~ 50 Month ~ 1528 Day Database 1085 records 1.24864 (Last Close) 2006-04-04 00~00 2010-06-10 00~00 (GMT+01:00) Paris BJF Trading Group MDunleavy chart" 1.7400|~15O||____________________________x___x_+_________________________|0.57%|39.77% 1.7250|~3OO||____________________________x_o_x_o_+_______________________|1.42%|38.57% 1.7100|~45O||____________________________x_o_x_o___+_____________________|2.28%|37.36% 1.6950|~6OO||____________________________x_o_x_o_____x___________________|3.14%|36.16% 1.6800|~75O||____________________________x_o___o_____x_o_________________|3.99%|34.95% 1.6650|~9OO||____________________________x_____o_____x_o_+_______________|4.85%|33.75% 1.6500|~1O5O|____________________________x_____o_x___x_o___+_____________|5.71%|32.54% 1.6350|~12OO|____________________x_______x_____o_x_o_x_o_____+___________|6.57%|31.34% 1.6200|~135O|____________x___x___x_o_x___x_____o_x_o_x_o_x_____+_________|7.42%|30.13% 1.6050|~15OO|____________x_o_x_o_x_o_x_o_x_____o_x_o_x_o_x_o_x___+_______|8.28%|28.93% 1.5900|~165O|____________x_o_x_o_x_o_x_o_x_____o___o_x_o_x_o_x_o_x_+_____|9.14%|27.72% 1.5750|~18OO|____________x_o_x_o_x_o_x_o_x_______+_o___o_x_o_x_o_x_o_+___|9.99%|26.52% 1.5600|~195O|x___________x_o_x_o_x_o_x_o_______+_______o_x_o_x_o_x_o___+_|10.85%|25.31% 1.5450|~21OO|x_o_________x_o_x_o_x_o_x_______+_________o___o_x_o_x_o_____|11.71%|24.11% 1.5300|~225O|x_o_________x_o___o_x_o_x_____+_______________o___o___o_____|12.57%|22.9% 1.5150|~24OO|x_o_____x___x_____o_x_o_x___+_________________________o_____|13.42%|21.7% 1.5000|~255O|x_o_x___x_o_x_____o_x_o_x_+___________________________o_____|14.28%|20.49% 1.4850|~27OO|x_o_x_o_x_o_x_____o___o_+_____________________________o_____|15.14%|19.29% 1.4700|~285O|x_o_x_o_x_o_x_________+_______________________________o_____|16%|18.08% 1.4550|~3OOO|x_o_x_o_x_o_________+_________________________________o_____|16.85%|16.88% 1.4400|~315O|x_o_x_o_x_________+___________________________________o_____|17.71%|15.67% 1.4250|~33OO|x_o_x_o_________+_____________________________________o_____|18.57%|14.47% 1.4100|~345O|x_o_x_________+_______________________________________o_____|19.42%|13.26% 1.3950|~36OO|x_o_x_______+_________________________________________o_____|20.28%|12.06% 1.3800|~375O|__o_x_____+___________________________________________o_____|21.14%|10.85% 1.3650|~39OO|__o_x___+_____________________________________________o_____|22%|9.65% 1.3500|~4O5O|__o_x_+_______________________________________________o_____|22.85%|8.44% 1.3350|~42OO|__o_+_________________________________________________o_x___|23.71%|7.24% 1.3200|~435O|__+___________________________________________________o_x_o_|24.57%|6.03% 1.3050|~45OO|______________________________________________________o_x_o_|25.42%|4.83% 1.2900|~465O|______________________________________________________o_x_o_|26.28%|3.62% 1.2750|~48OO|______________________________________________________o_+_o_|27.14%|2.42% 1.2600|~495O|______________________________________________________+___o_|28%|1.21% 1.2450|~51OO|__________________________________________________________o_|28.85%|0.01% 1.2300|~525O|__________________________________________________________+_|29.71%|-1.2% Column|||||||1_1_1_5_6_4_1_6_6_9_1_1_9_4_1_4_4_1_4_5_8_1_5_6_5_5_4_2_4_6_| Count||||||||2_5_1_______1_______O_O_____2_____O_______O___________1_____| http://iticsoftware.com/postimages/201005/BJF-Trading-Group-EurCad0611tumb.PNG BJF-Trading-Group_Excel_Chart
-
Trade Idea: AUD/CAD - Sell Limit at 0.8790; Target: 0.8560 ; Stop: 0.8840. ========================================================================== Очень интересная экзотическая пара. Как правило везде с высоким спредом, Ходит как трамвай, по синусоиде почти , я имею в виду почти спрогнозированно. В настоящее время канадский доллар пред почтительнее австралийского, потому дорожает относительно последнего. The AUD/CAD has been trading close to a bearish trend-line since the beginning of 2010 and boosted this trend in May once again. But it fell to a multi month low yesterday at 0.8668. Now it seems that the currency pair may try to build a basement around this level. The CCI recovered near its - 100 level and the RSI indicator may suggest an oversold market adding signs that the bulls could try to cross the stronger bearish trend-line. "P&F AUDCAD1440 Box Size 10X4 or(4.52%) HI/LO Data 1.055 - 0.7164 ~ 92 Month ~ 2795 Day Database 2000 records 0.87781 (Last Close) 2002-10-09 00~00 2010-06-04 00~00 (GMT+01:00) Paris BJF Trading Group MDunleavy chart" http://iticsoftware.com/postimages/201005/BJF-Trading-Group-AUDCAD0605tumb.PNG BJF-Trading-Group_Excel_Chart
-
Евро настолько слабо, что не исключёт пробой ключевого сопротивления. Хотя и фунт не выглядит красавцем. Такое впечатление, что все валюты взялись соревноваться кто упадёт ниже. Trade Idea:EUR/GBP - Sell Limit at 85.30 Target: 84.00 ; Stop:86.10 ========================================== The royal pair closed negatively yesterday below the initial support levels-turned into resistance at 0.8605-. Consequently, it might retest the broken downtrend line of the descending channel before resuming the bullishness, which is based on the suggested double bottom formation. We are not sure that the above mentioned trend line could assist the pair to consolidate once more as the indicators shows consecutive negative signs. Thus, we need more confirmation and therefore our outlook will be neutral until we see a stable move above 0.8605 zones. The trading range for today is among the key support at 0.8420 and key resistance now at 0.8720 "P&F EURGBP1440 Box Size 120X3 or(4.49%) HI/LO Data 0.9799 - 0.6244 ~ 92 Month ~ 2808 Day Database 2000 records 0.85229 (Last Close) 2002-09-16 00~00 2010-05-25 00~00 (GMT+01:00) Paris BJF Trading Group MDunleavy chart" http://iticsoftware.com/postimages/201005/BJF-Trading-Group-EurGbp0525_%281%29.PNG BJF-Trading-Group_Excel_Chart
-
Ещё раз к вопросу о волнах. На тех депозитах, которые использует большинство торгующих, это не миллионы ясное дело, волновой анализ имеет исключительно познавательное значение. Хотя для отслеживания общей тенденции движения чужих денег вполне пригоден. Вот возьмём к примеру фунт. Кто отважится сейчас заявить, что завершена пятая или третья волна Если сказать, что волн было три , то тогда что ждать ещё две? Тогда фунт будет ещё падать.Если волн было пять, то всё фунт пошёл в рост. Я лично склоняюсь к мысли, что волн всё же было пока три...Но я никто в волновом анализе.. Потому мнение моё ничто... Всё же стратегии должны строиться исходя из размеров депозита. А данный график, где я произвёл "разметку" ( я крестики имею в виду) игнорирует движения размером 600 пунктов... Кто может позволить себе стопик в 600 пунктов? А строить волны на часовых свечах это больше времени уйдёт на построение чем на торговлю... Картинки прилагаю.. http://img709.imageshack.us/img709/2784/bjftradinggroupgbpusd05.png BJFTradingGroupGBPUSD0521.xls

-
Да, действительно падение евро настолько сильно, что под сомнением мощная поддержка в районе 1,24-1,23. После уверенного прохождения этого рубежа можно будет дискутировать даже тему паритета А пока в расчёте на отскок можно поставить ордер Buy-stop от указанного уровня. Trade Idea:EUR/USD - Buy-stop at 1.2650 Target: 1.2800 ; Stop: 1.2575 ====================================================================== Price action on EUR/USD, a chart of which is shown, has just broken down swiftly below the key 1.2500 support level, establishing a new 18-month low and lending a significant additional bearish bias to this strongly downtrending currency pair. A continuation of the steep overall downtrend has now been confirmed, with price currently targeting a key downside support target in the 1.2300 price region. Any substantial breakdown below 1.2300 could potentially begin to target the technically- and psychologically-important 1.2000 level, which is also around a 161.8% Fibonacci extension of the most recent bearish run. The broken 1.2500 level should now serve as tentative upside resistance within the context of the strong current downtrend. "P&F EURUSD1440 Box Size 200X3 or(4.68%) HI/LO Data 1.6038 - 0.9607 ~ 92 Month ~ 2796 Day Database 2000 records 1.23566 (Last Close) 2002-09-17 00~00 2010-05-14 00~00 (GMT+01:00) Paris BJF Trading Group chart" http://iticsoftware.com/postimages/2009-Jun-19/BJF-Trading-Group-EURUSD_0515-L_%282%29.PNG BJF-Trading-Group_Excel_Chart
-
Вот например экзотика, евро\новозеландский доллар. Однако волатильность очень высокая. Разные есть тому объяснения по NZD, читал даже такие, что ввиду небольшого количества самих новозеландский долларов (из-за размера страны) порождает такую вот волатильность...Но доказательств для данного утверждения не приводилось.Волатильность помимо всего прочего зависит от банальной арифметики, т.е. очень волатильными кажутся пары где соотношение одной валюты к другой превышает 2 или близко к этому. Но волатильность можно смотреть и в процентах, такая картина яснее...или пересчитывать в пунктах по доллару.. Trade Idea: EURNZD - Sell at 1.800 Target: 1.6400, Stop: 1.8200 ============================================= We are going into a period of potentially unusual price action at the beginning of the week. An extended holiday for US, UK and New Zealand markets will warp liquidity which could lead to untimely breakouts or simply a drop back into congestion bands. This presents significant risk to all range-based strategies; but EURNZD may have a better grounding for holding its congestion. "P&F EURNZD1440 Box Size 300X3 or(4.27%) HI/LO Data 2.5792 - 1.6343 ~ 84 Month ~ 2562 Day Database 1833 records 1.7729 (Last Close) 2003-05-07 00~00 2010-05-12 00~00 (GMT+01:00) Paris BJF Trading Group chart" http://iticsoftware.com/postimages/2009-Jul-01/BJF-Trading-Group-EURNZD_0512_%281%29.PNG BJF-Trading-Group_Excel_Chart
-
Спреды бывают высокими по этой паре, но зато хорошо отзываеется на фундаментальные данные. After crossing the bearish trend line inside the upward trend channel, the NZD/USD pulled back from its horizontal resistance line around 0.7310. It was the markets' fifth touch with the lower line of the channel before it recovered back to its current price. If the market breaks the horizontal resistance around 0.7310, we might see further gains. Otherwise, it might continue its bullish zigzag phase inside the bullish channel. "P&F NZDUSD1440 Box Size 125X3 or(5.83%) HI/LO Data 0.8214 - 0.4644 ~ 93 Month ~ 2811 Day Database 2000 records 0.71823 (Last Close) 2002-08-30 00~00 2010-05-11 00~00 (GMT+01:00) Paris BJF Trading Group chart" http://iticsoftware.com/postimages/2009-Aug-03/BJF-Trading-Group-NzdUsd_0511_%281%29.PNG BJF-Trading-Group_Excel_Chart
-
Предполагаю, что пока движения вверх не будет, возможно после консолидации, а в краткосрочном периоде всё же вниз. USDJPY is currently trading 94.70 levels. A break above 94.30(2 days close), we could target 97-98 levels. Weekly close above 92 levels has increased chances for a bearish move for the yen currency. Importers hold for medium term covers. (USDJPY- 94.70). Long Term (3-6 months) target 98 and higher.We just need a conistent break of 94.30 to make thes happen. "P&F USDJPY1440 Box Size 140X4 or(5.32%) HI/LO Data 125.75 - 84.819 ~ 92 Month ~ 2800 Day Database 2000 records 94.26 (Last Close) 2002-09-04 00~00 2010-05-05 00~00 (GMT+01:00) Paris BJF Trading Group chart" 126.00|~14O||_____________________________|-0.2%|48.55% 124.60|~28O||XoX__________________________|0.91%|46.9% 123.20|~42O||XoXo________X________________|2.03%|45.25% 121.80|~56O||XoXo______X_Xo_______________|3.14%|43.6% 120.40|~7OO||Xo_o____X_XoXo_______________|4.25%|41.95% 119.00|~84O||X__o____XoXoXo_______________|5.37%|40.3% 117.60|~98O||___o____XoXoXoX______________|6.48%|38.65% 116.20|~112O|___o____XoXo_oXo_____________|7.59%|37% 114.80|~126O|___o__X_XoX__oXo_____________|8.71%|35.35% 113.40|~14OO|___o__XoXoX__oXoX____________|9.82%|33.7% 112.00|~154O|___oX_XoXoX__o_oXo___________|10.93%|32.05% 110.60|~168O|___oXoXoXoX____oXoX__________|12.05%|30.4% 109.20|~182O|___oXoXoXo_____oXoXo_________|13.16%|28.74% 107.80|~196O|___oXoXoX______o_oXo_________|14.27%|27.09% 106.40|~21OO|___o_oXoX________oXo_________|15.39%|25.44% 105.00|~224O|_____oXoX________oXo_________|16.5%|23.79% 103.60|~238O|_____o_oX________oXo_________|17.61%|22.14% 102.20|~252O|_______o_________oXo_________|18.73%|20.49% 100.80|~266O|=================oXo======X==|19.84%|18.84% 99.40|~28OO||_________________oXoX___X_Xo_|20.95%|17.19% 98.00|~294O||_________________oXoXo__XoXo_|22.07%|15.54% 96.60|~3O8O||_________________o_oXo__XoXo_|23.18%|13.89% 95.20|~322O||___________________oXo__XoXo_|24.29%|12.24% 93.80|~336O||===================oXoX=Xo=oX|25.41%|10.59% 92.40|~35OO||___________________oXoXoX__oX|26.52%|8.94% 91.00|~364O||___________________o_oXoX__oX|27.63%|7.29% 89.60|~378O||_____________________oXoX__oX|28.75%|5.64% 88.20|~392O||_____________________o_o___oX|29.86%|3.99% 86.80|~4O6O||___________________________oX|30.97%|2.34% 85.40|~42OO||===========================o=|32.09%|0.68% 84.00|~434O||_____________________________|33.2%|-0.97% Column|||||||54314689189458474111684484516| Count||||||||___3____3________2O4_______1_| http://iticsoftware.com/postimages/2009-Aug-03/BJF-Trading-Group-UsdJpy_0505_%281%29.PNG BJF-Trading-Group-UsdJpy_0505.zip
-
Пара евро\ена это пара на которой нужно "разминаться" перед торговлей фунт\ена. По этой паре всегда много аналитики и краткосрочной и долгосрочной, есть бесплатные эксперты и советники. EURJPY Outlook As you can see in charts below, the lower line of the bullish channel did a good job preventing further bearish pressure and keep the bullish scenario intact. The bias is neutral in nearest term as we haven't see significant bullish momentum so far. Immediate resistance at 125.65. Break above that area could trigger further bullish momentum targeting 126.50 region. Initial support at 124.66 (current low). Break below that area could trigger further downside pressure re-testing the lower line of the bullish channel once again. "P&F EURJPY1440 Box Size200X3 or(4.25%) HI/LO Data 169.97 - 112.16 ~ 37 Month ~ 1152 Day Database 825 records 124.7 (Last Close) 2007-03-05 00~00 2010-04-30 00~00 (GMT+01:00) Paris BJF Trading Group chart" http://iticsoftware.com/postimages/2009-Jul-01/BJF-Trading-Group-EURJPY_0504_%281%29.PNG BJF-Trading-Group-EURJPY_0504.xls
-
Опираясь на фундаментальные данные очень привлекательной для торговли может быть пара EUR\CHF. Кроме того в этой паре редко бывают "непредвиденные" сильные движения. Но с другой стороны волатильность не сравнима скажем с парой EUR\JPY , значительно ниже. По данной паре наряду с парой AUD\NZD есть бесплатные эксперты и советники. Есть один мощный платный советник и автоматическая торговая система, целый сайт ей посвящён с форумом и так далее...Легко найти при желании. Среднесуточное колебание H\L по паре евро\франк около 80-82 пункта если взять первые 1000-1100 дневных свечей и вычислить среднее значение. EUR/CHF Weekly Outlook Despite dipping to 1.4294 briefly, there was no follow through selling and EUR/CHF recovered back into familiar range. Outlook is turned neutral again and more choppy sideway trading might be seen. On the downside, break of 1.4294 will argue that rebound from 1.4143 is completed at 1.4465 already and turn bias to the downside for this support first. On the upside, above 1.4386 will suggest that stronger recovery might be seen. But after all, we'd continue to expect strong resistance near to 1.4557 support turned resistance to limit upside and bring fall resumption sooner or later. "P&F EURCHF1440 Box Size 100X3 or(1.94%) HI/LO Data 1.6827 - 1.4144 ~ 92 Month ~ 2811 Day Database 2000 records 1.43556 (Last Close) 2002-08-16 00~00 2010-04-27 00~00 (GMT+01:00) Paris BJF Trading Group chart" http://iticsoftware.com/postimages/2009-Jun-19/BJF-Trading-Group-EurChf_0427_%281%29.PNG http://iticsoftware.com/postimages/2009-Jun-19/bjf-trading-group-eurchf_0427-2_%281%29.gif BJF-Trading-Group_Excel_Chart
-
Предположительно падение евро ещё не достигло дна. Предполагаю, что ещё одна волна снижения в район 1,3140 может быть. What's In Store for the EUR and the USD Next Week? At the end of a volatile trading week which has seen a turmoil in Greek bonds and has culminated with a formal request from Greece for financial aid from the EU and IMF, I explore the important economic events for the week ahead and ponder what they may bring for the EUR and the USD, I examine this morning's EUR strengthening and analyze the latest trend developments with the EUR/USD, EUR/JPY and EUR/GBP currency pairs, I note the bullish breakout of the USD vs. JPY, I examine the weakness of the GBP and CAD after series of disappointing economic reports from the U.K. and Canada. This is my forecast! "P&F EURUSD1440 Box Size 200X3 or(4.68%) HI/LO Data 1.6038 - 0.9607 ~ 92 Month ~ 2796 Day Database 2000 records 1.33811 (Last Close) 2002-08-27 00~00 2010-04-23 00~00 (GMT+01:00) Paris BJF Trading Group chart" http://iticsoftware.com/postimages/2009-Jun-19/BJF-Trading-Group-EurUsd_0424-MT_%281%29.PNG http://iticsoftware.com/postimages/2009-Jun-19/BJF-Trading-Group-EurUsd_0424_%281%29.PNG BJF-Trading-Group_Excel_Chart
-
Банк Канады: еще немного, еще чуть-чуть… Сегодня Банк Канады оставил учетную ставку без изменений, на текущем минимуме 0,25%, заявив о том, что период повышения ставок наступит раньше, чем оговаривалось до этого, в связи с ускорением темпов роста экономики и инфляции. "С учетом недавно улучшегося экономического прогноза, уже нет такой необходимости в такой мягкой политике, и будет уместным, если мы начнем снижать степень монетарного стимулирования", - заявил сегодня Центробанк. http://iticsoftware.com/postimages/2009-Jun-19/2010-Apr-20_19~37~11.PNG
-
Кросс GbpCad на протяжении длительного времени снижался и по всей видимости достиг дна. Сейчас возможно восстановление. Подробности на графике. GbpCad Review and Outlook ========================= GbpCad=GbpUsdXUsdCad GBP/USD closed higher due to short covering on Monday. The high-range close sets the stage for a steady to higher opening on Tuesday. Stochastics and the RSI are neutral signalling that sideways to higher prices are possible near-term. If it extends last week's decline, March's high crossing is the next downside target. Closes above the 20-day moving average crossing are needed to confirm a short-term low has been posted. Long term bias for the USD/CAD bearish, the weekly close below 1,0250 signals further declines. Forming a base around parity. "P&F GBPCAD1440 Box Size 300X3 or(4.65%) HI/LO Data 2.3563 - 1.5115 ~ 58 Month ~ 1762 Day Database 1303 records 1.5535 (Last Close) 2005-06-23 00~00 2010-04-20 00~00 (GMT+01:00) Paris BJF Trading Group chart" http://iticsoftware.com/postimages/2009-Jul-01/BJF-Trading-Group-GbpCad_0420_%281%29.PNG http://iticsoftware.com/postimages/2009-Jul-01/bjf-trading-group-gbpcad_0420-2_%281%29.gif BJF-Trading-Group_Excel_Chart
